With the calendar having flipped to May, we are rapidly approaching the summer months in the Northern Hemisphere, where about 90 percent of the human population lives. According to NASA, last summer was the warmest on record (going back to 1880), with June, July, and August coming in 0.41 degrees (Fahrenheit) warmer than any other summer and 2.1 degrees warmer than the average summer between 1951 and 1980. The summer was filled with record heat waves in all parts of the world, and trends would indicate that we can probably expect much of the same this summer and for most summers moving forward.
These heat waves – and the heat in general – aren't as readily apparent and in-your-face as other events caused and/or exacerbated by climate change, but they can be just as deadly. Data isn’t yet available for the death toll related to heat waves in 2023, but according to Reuters an estimated 61,000 people died from heat during European heat waves in 2022. Furthermore, estimates from the World Meteorological Organization indicate that heat-related mortality has increased by around 30 percent in the past 20 years.
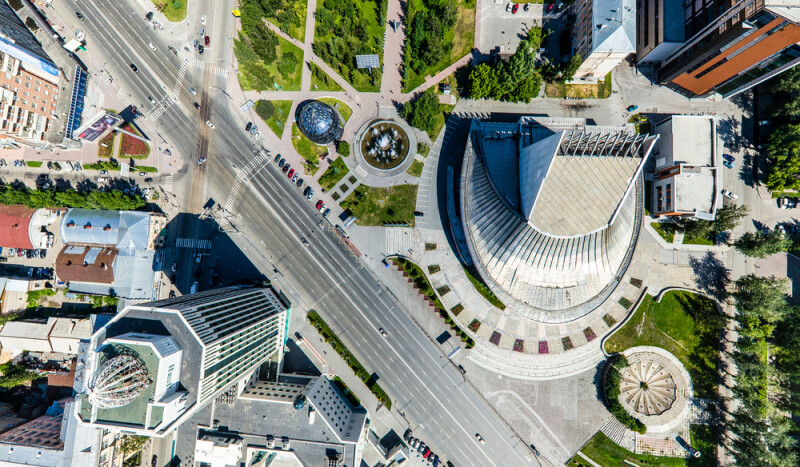
All of this is to say that mitigating the effects of increasing heat waves needs to be a central focus of governments all around the globe. This is particularly true in cities, where about 56 percent of the world’s population reside today, with that number estimated to climb to almost 70 percent by 2050. Urbanized areas, of course, contain less green space than their rural counterparts, forming what is known as “urban heat islands” that absorb more heat in building, roads, and other manmade structures compared to natural areas.

There has been plenty of work around identifying where urban heat islands exist and who is most affected in a given population, but there is still progress to be made in identifying granular insights into these questions from which policy decisions can be made. Gramener is the kind of company that looks to solve these problems using geospatial data and artificial intelligence, as we’ve highlighted in the past with their work around typhoons in India. Recently, Geo Week News spoke to Gramener Senior Director Shravan Kumar about similar work being done to gather insights around urban heat island effects.
Kumar relays that this is the kind of work that Gramener excels at, telling Geo Week News that the company has “aced the concept of breaking down whatever problem our client has, breaking it down into pieces that can be solved with technology.”
In this case, the problem was raised by an undisclosed city in Canada, dating back about five years ago. He noted that they had been working on experimental models around flood risk mitigation and urban heat islands, and Canada was “at the middle of this storm” given their increasingly long summers and subsequent glacier melting. Ultimately, this project specifically around urban heat islands came in partnership with an undisclosed organization who was working to create greener and cleaner cities in Canada. Today, the work has extended to a variety of places around the world in addition to Canada, including the U.S., India, Taiwan, and Paraguay.
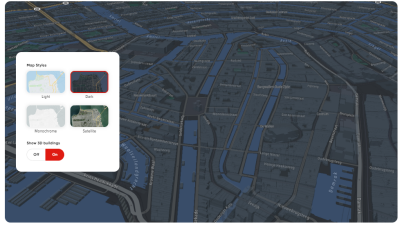
So, how does it work? Gramener’s model starts with a few different types of data to form the basis of their algorithm, including satellite imagery – Kumar tells Geo Week News they do have access to some privately owned imagery, but for this project mostly rely on data from open sources like Landsat and Sentinel – along with temperature data, lidar data for 3D representation of a city, building permitting data, and population data.
From there, it’s all about finding various correlations. They are looking for areas that are particularly affected by this urban heat island phenomenon, and looking for how different datasets interact in those areas to predict what combination of factors will most result in extreme heat, particularly in underserved areas.

“We’re looking for vegetation, we’re looking for buildings, we’re looking at correlation,” Kumar said. “We can run through some correlation, which will tell me: If the vegetation and the building in this area is built up this way, the temperature of that particular area could be this much, or this range. We’re looking for causality, and the relationship between these other variables that we have from satellite imagery, temperature, and building data.”
There are a number of insights that can be made with this level of data, getting down into granular data like building age and height, among other factors, and seeing how they interact. Kumar was able to give a few examples of policy decisions that came out of this. For example, he noted that when one area was looking to build a new playground they needed factors that would ensure that, during the peak of summer, people can comfortably enjoy the park. Based on findings from Gramener’s model, they knew they needed to find a space with minimal surrounding buildings that had some proximity to a water body, and where they would be able to plant additional vegetation.
In another example, they looked at buildings roofs and found patterns in which darker roofs were capturing more heat and creating that urban heat island effect. Now, public buildings are either painted white or made “green” with vegetation added to the top of the roof. Additionally, Kumar mentioned a policy derived from this model’s insights that mandated parking surfaces have tree canopy equal to one-tenth of the area the parking lot occupies.
Adverse effects from extreme heat don’t get the same kind of publicity as other kinds of weather events, but for local city governments finding ways to reduce these effects as much as possible is crucial. To do that, they need to find these kinds of correlations that are more easily derived from massive datasets being parsed by algorithms like this one put together by Gramener.
“If you look at other climate events, like floods and earthquakes, how frequent are they?” asked Kumar. “Heat waves happen almost every year. If you compound that effect over five years, you will realize that a heat wave would have much more impact than a flood would. We realized there was a lot of focus on floods, but close to zero with respect to mitigating heat waves.”